Card 26 of 40· Monitor
Tracing: where the data lives and how to query it
Traces land in Application Insights and you query them with KQL. The span attributes that matter, and the one decision that makes tokens-per-outcome computable at all.
"Monitor this" is not an instruction until you know where the data is. This card is
the plumbing, and it contains one decision that determines whether the metric you
actually want is computable at all.
Where traces go
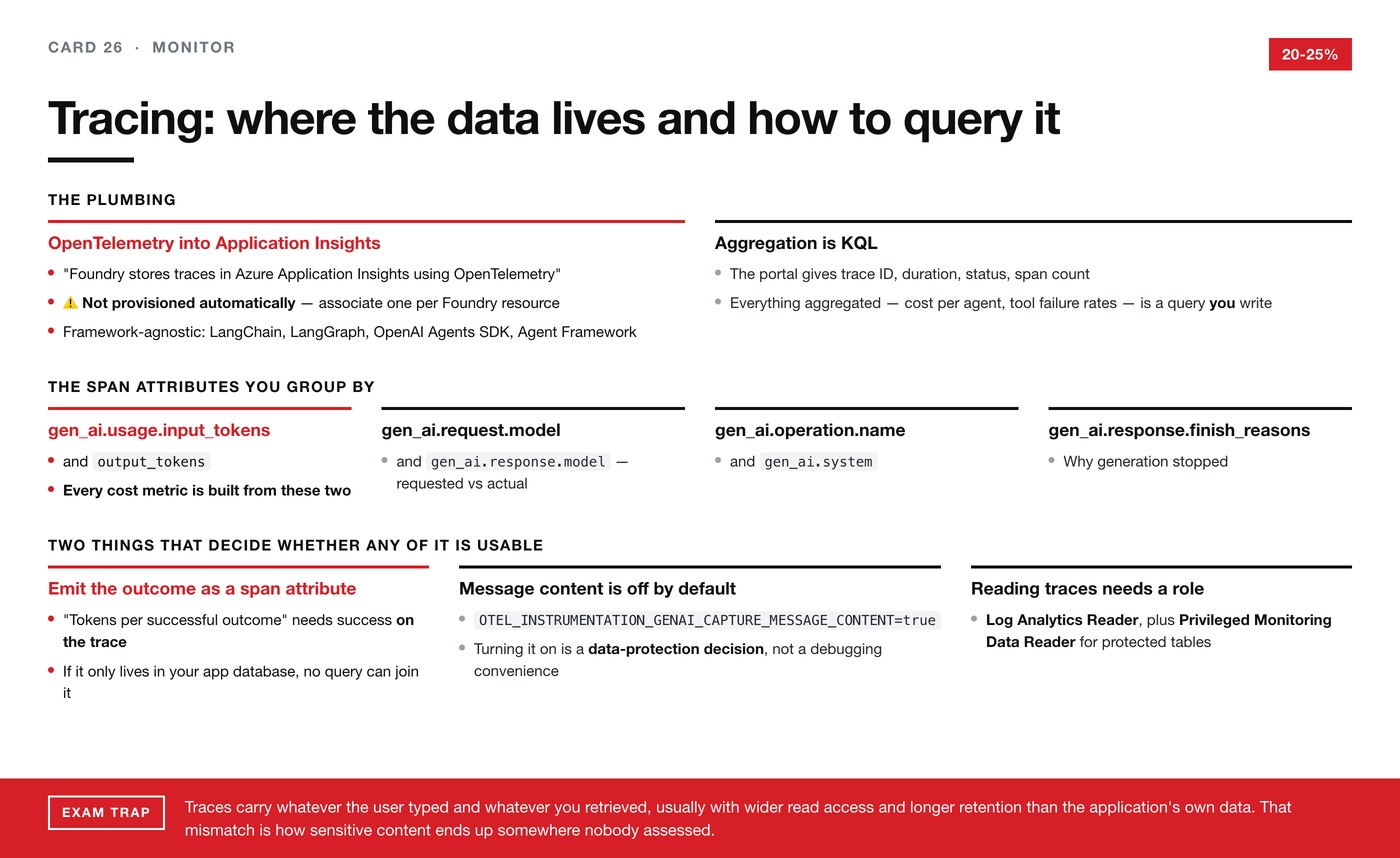
Foundry stores traces in Azure Application Insights using OpenTelemetry.
Two details matter immediately.
It is not automatic: "New resources don't provision Application Insights
automatically. Associate (or create) a resource once per Foundry resource." So step
one of any monitoring design is attaching an Application Insights resource. Every
project in that Foundry resource then has tracing.
It is OpenTelemetry, not a proprietary format — which means agent traces join
the same system as the rest of your estate, and a correlation ID can genuinely
thread from a web request through an orchestrator, through four agents, into a tool
and out to a downstream service. It is also framework-agnostic: LangChain,
LangGraph, the OpenAI Agents SDK and Agent Framework are all supported.
Which means the query language is KQL
The Foundry portal's Tracing view gives you trace ID, start time, duration, status
and span count, per trace. That is enough to inspect one run.
Everything aggregated — tokens per successful outcome, cost per agent, tool
failure rates by tool, loop count over time — is a KQL query you write, not a
dashboard you find. If you are designing monitoring for an agent system, you are
designing a set of queries.
The span attributes you group by
Traces follow the OpenTelemetry GenAI semantic conventions, and these are the names
worth recognising:
gen_ai.usage.input_tokens and gen_ai.usage.output_tokens — every cost and
efficiency metric is built from these two.
gen_ai.request.model and gen_ai.response.model — what you asked for and what
answered, which are not always the same.
gen_ai.operation.name and gen_ai.system.
gen_ai.response.finish_reasons — why generation stopped.
The one decision that makes or breaks it
Here is the part worth carrying away.
Tokens per successful outcome is the most useful single metric in agent
monitoring. Computing it means summing gen_ai.usage.*_tokens across the spans of a
trace and dividing by whether that trace succeeded.
Which means the outcome has to be on the trace.
If "did this case get resolved" lives only in your application database, no KQL
query can join it to the token counts. The metric is not hard to compute — it is
impossible to compute, and you will not find that out until you try.
So emit the outcome as a span attribute at the point you know it. That one
decision is the difference between a metric you can compute and a metric you can
only describe in a design document.
The general mechanism: tracer.start_as_current_span("...") wraps a section of
business logic, and current_span.set_attribute(...) adds the dimension you want to
group by — agent name, tenant, case type, outcome.
Two governance facts
Message content is off by default. You opt in withOTEL_INSTRUMENTATION_GENAI_CAPTURE_MESSAGE_CONTENT=true.
That default is deliberate and it is the right one. Turning it on is a
data-protection decision, not a debugging convenience — a prompt contains
whatever the user typed and whatever you retrieved, which in a support system is
personal data and in a clinical one is worse.
Reading traces needs its own role. You need Log Analytics Reader on the
Application Insights resource, plus Privileged Monitoring Data Reader if the
underlying Log Analytics tables are protected.
So "who can see agent traces" has a specific answer — and given what traces contain
once message capture is on, it should.
The trap
Traces are usually stored with different retention and a wider read audience
than the application's own data.
That mismatch is how sensitive content ends up somewhere nobody assessed. The
sensible default is to capture prompt metadata and hashes — length, template
version, retrieved document IDs — and full text only where a case is flagged for
review, under an access control you can defend.
You get debuggability without turning your telemetry store into an unassessed copy
of your most sensitive data.