Card 27 of 40· Monitor
The agentic monitoring signals
Loop count, tool-call failure, escalation and refusal rates — and the single metric that catches almost everything.
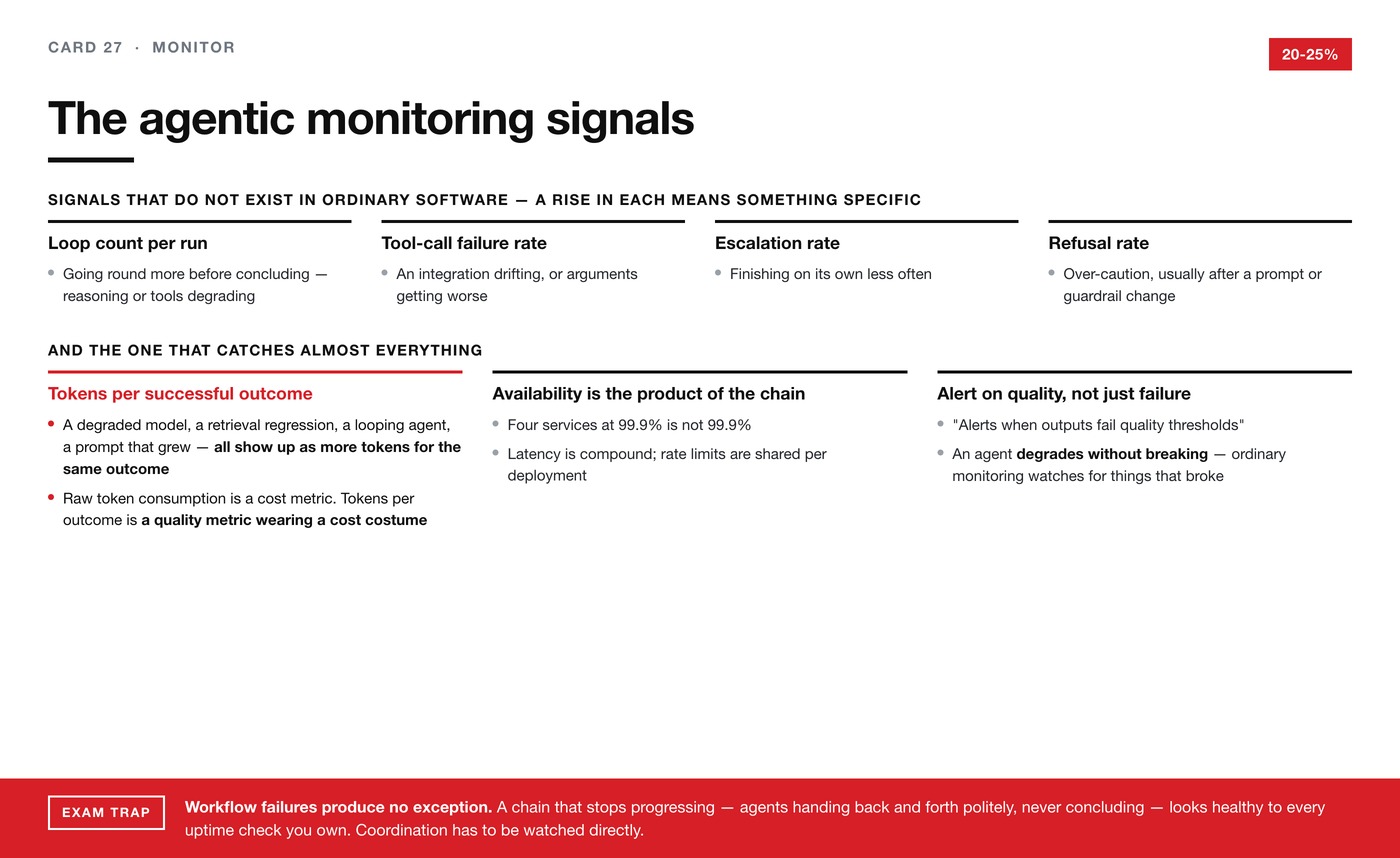
Ordinary software monitoring watches for things that broke. An agent degrades
without breaking, which is why this list exists and why none of it appears on a
normal dashboard.
The signals that do not exist in ordinary software
Each of these is a number, and a rise in each means something fairly specific.
Loop count per run. Agents going round more times before concluding. Something
in the reasoning or the tools is getting worse — the agent is having to work harder
for the same result.
Tool-call failure rate. An integration drifting, or the arguments the agent
constructs getting worse. Worth splitting by tool, because the aggregate hides
which one.
Escalation rate. The agent finishing on its own less often. This one is
particularly useful because it is honest — the agent is telling you it could not
do the job.
Refusal rate. Usually moves after a prompt or guardrail change, and usually
towards over-caution. A refusal rate that jumps overnight is a change nobody tested
for false positives.
And the one that catches almost everything
Tokens per successful outcome.
A degraded model, a retrieval regression, a looping agent, a prompt that quietly got
longer — all of them show up as more tokens for the same outcome. It is the closest
thing to a single health number that agent systems have.
The framing worth remembering: raw token consumption is a cost metric; tokens per
outcome is a quality metric wearing a cost costume. Finance will look at the
first. You should be looking at the second, because it moves before anything else
does.
Alerting on quality, not just failure
Foundry's production monitoring integrates with Application Insights and provides
"real-time dashboards tracking operational metrics, token consumption, latency,
error rates, and quality scores", with "alerts when outputs fail quality
thresholds or produce harmful content."
That last clause is the agentic difference. You can alert on quality, not only on
failure — which you have to, because the failure mode you actually fear does not
produce an error.
Availability, and three things that are not intuitive
Your availability is the product of the chain. Four services at 99.9% each is
not a 99.9% system. Every downstream dependency an agent reaches multiplies in.
Latency is compound. An agent making six sequential tool calls has six
round-trips of latency, plus the model time between them, and the user experiences
the sum.
Rate limits are shared per deployment. Which is why the batch job and the
interactive agent should not share one — and why "we parallelised it and it did not
get faster" is usually a capacity question.
Automated remediation
The syllabus asks for it, and the rule is short: every automated remediation needs
a manual override and a loud signal.
A system that quietly restarts a failing agent is a system where you find out about
the underlying problem in three months, having lost the evidence. Remediation
should buy time and announce that it did.
The trap
Workflow failures produce no exception.
A chain that stops progressing — agents handing back and forth politely, each one
technically succeeding, nothing ever concluding — looks completely healthy to every
uptime check you own. No errors. No timeouts. Normal latency per call.
Coordination has to be watched directly: is the task actually advancing? Which is
the syllabus's "cross-agent coordination tracking", and it is not something you
get for free from anything else on this card.