Card 22 of 44· Domain 3 · Deploy
Monitoring vs evaluation — the distinction behind many questions
Why a green dashboard is fully compatible with an agent that is systematically wrong, what to instrument, and why the fallback log is the best single investment you can make.
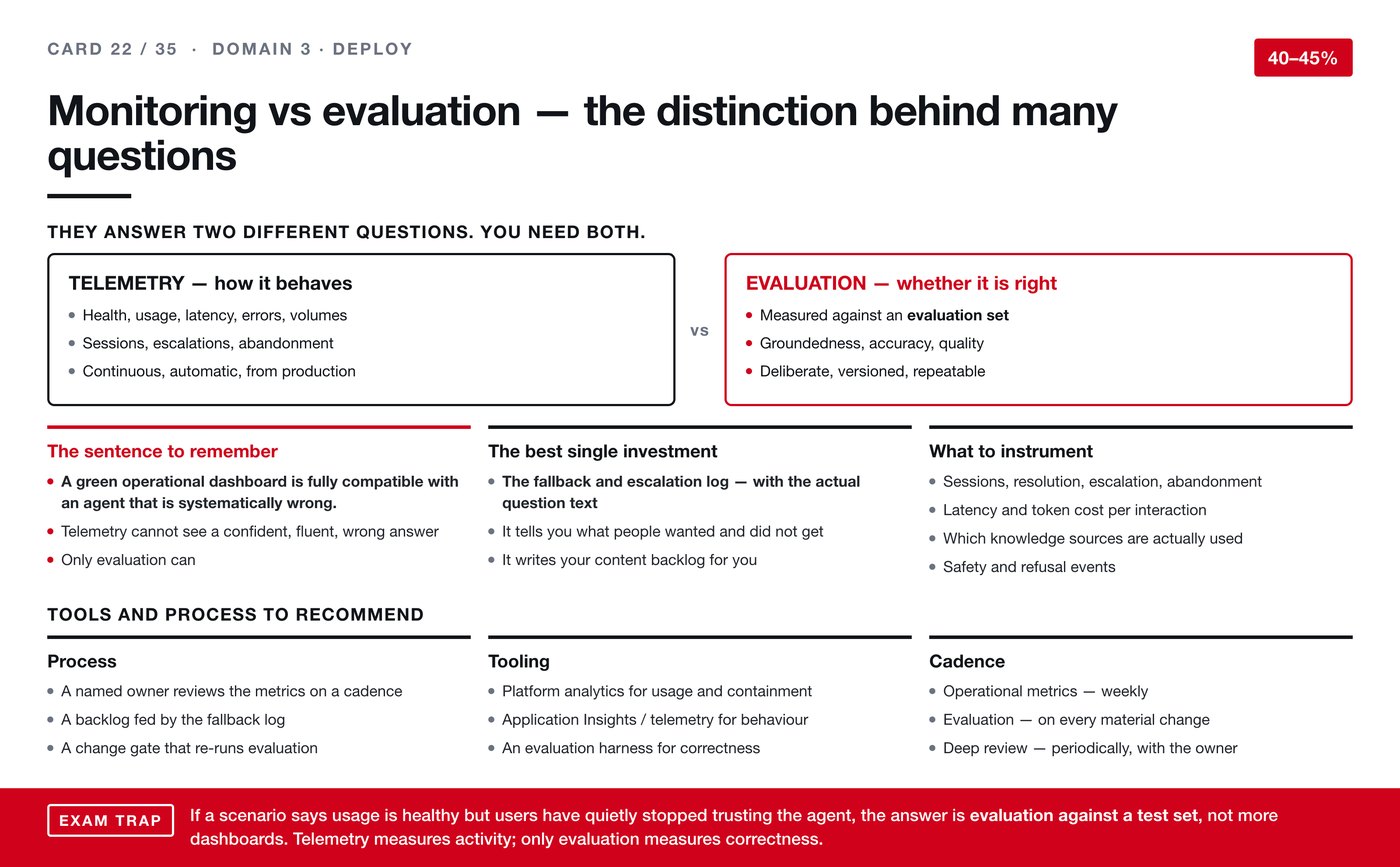
Domain 3 is the largest block on the exam, and it opens with a distinction that
sits underneath a great many of its questions. Get this one clear and several
scenarios answer themselves.
Two different questions
Telemetry tells you how it behaves. Health, usage, latency, errors, volumes.
Sessions, escalations, abandonment. It is continuous, automatic, and comes
straight out of production.
Evaluation tells you whether it is right. Measured against an evaluation set.
Groundedness, accuracy, quality. It is deliberate, versioned and repeatable.
You need both, and they are not substitutes.
The sentence to remember
A green operational dashboard is fully compatible with an agent that is
systematically wrong.
Telemetry cannot see a confident, fluent, wrong answer. Every metric looks
healthy: the request completed, the latency was fine, nobody threw an error. Only
evaluation catches it, because only evaluation compares the answer to what the
answer should have been.
If you take one idea from Domain 3, take that one.
The best single investment
The fallback and escalation log — with the actual question text.
It tells you what people wanted and did not get, which is the most honest signal
any system produces. And it writes your content backlog for you, because the
questions that fell through are exactly the material you are missing.
What to instrument
Sessions, resolution, escalation, abandonment. Latency and token cost per
interaction. Which knowledge sources are actually being used. Safety and refusal
events.
That third one repays attention: knowledge nobody retrieves is either wrong,
badly described, or unnecessary, and you cannot tell which until you look.
Tools, process and cadence
Process. A named owner reviewing the metrics on a cadence. A backlog fed by
the fallback log. A change gate that re-runs evaluation.
Tooling. Platform analytics for usage and containment. Application Insights
and telemetry for behaviour. An evaluation harness for correctness.
Cadence. Operational metrics weekly. Evaluation on every material change. A
deeper review periodically, with the owner.
Exam trap. If a scenario says usage is healthy but users have quietly stopped
trusting the agent, the answer is evaluation against a test set, not more
dashboards. Telemetry measures activity; only evaluation measures correctness.
The one line to carry: activity and correctness are different measurements,
and a healthy dashboard says nothing at all about whether the answers are true.
Currency (19 Aug 2026). Three additions worth knowing: the agent inventory schema
(discover and audit every agent from the admin center, an API, or Azure Resource Graph),
the Analytics Viewer role (analytics access without maker permissions), and
activity maps (the agent's sequence of inputs, decisions and outputs). See card 44.